
Analyze your key real estate markets for hidden growth opportunities & risks with Geospex™ Location Analytics.
.jpg)
See how it all works with a Free Trial.
What is Geospex?
Geospex combines planned real estate development data with GIS (Geographic Information System) data layers to provide new insights into a market's growth opportunities and potential risks.
Get answers to common questions like:
- "What new developments are planned for this area and who is responsible?
- "Where are my competitors building?"
- "Where are opportunity zones in relation to projects of interest?"
- "In which census regions are the most the new developments and renovations?"
- "Who owns the parcel of land adjacent to my target development/investment?
- "How close is the nearest flood zone?"
- "What are the regional crime rates?"
- "What are the demographics represented in this region?
- How close is this project to known wildfires and wildfire zones?"
Why Geospex?
- Data visualization is more critical now than ever for market analysis, monitoring competition, risk analysis, forecasting, and trend spotting. Geospex delivers that in spades.
- Get unique location-based perspectives that you can't get from looking at a data table—often more easily, and in more depth. See projects in context against intelligent data layers provided by the U.S Census Bureau, the Bureau of Land Management, and more.
- Add your custom data for compatibility with your existing workflow.
|
GIS BASIC MAP |
Geospex™ |
|
Map 15,000 points at a time |
Map 15,000 points at a time |
|
Search and map any location |
Search and map any location |
|
Imagery/ Satellite Hybrid
Street View Streets at Night (Dark) Topographic Light Gray Dark Gray |
Imagery/ Satellite Hybrid Street View Streets at Night (Dark) Topographic Light Gray Dark Gray |
|
View County overlay
|
View County overlay |
|
View Zip overlay
|
View Zip overlay |
|
View MSA Overlay
|
View MSA Overlay |
|
N/A
|
Force Map View in Project List |
|
View the projects added in the last 2 weeks
|
View the projects added in the last 2 weeks |
|
View all projects added since your last login
|
View all projects added since your last login |
|
Measure distance between two points
|
Measure distance between two points |
|
N/A
|
Cumulative Project Value Estimates |
|
N/A
|
Heatmap |
|
N/A
|
Cluster Map |
|
N/A
|
Drawing Layers |
|
N/A
|
Opportunity Zones |
|
N/A
|
Census Regions |
|
N/A
|
Parcel Data |
|
N/A
|
Aiports Layer |
|
N/A
|
FEMA Flood Zones |
|
N/A
|
EPA Superfund Sites |
|
N/A
|
American Indian Reservations |
|
N/A
|
Municipal Boundaries |
|
N/A
|
EPA Brownfield Sites |
|
N/A
|
NOAA Monthly Precipitation Outlook |
|
N/A
|
NOAA Atlantic Hurricane |
|
N/A
|
NOAA Weather Warnings |
|
N/A
|
NOAA Snow Depth |
|
N/A
|
Railroads |
|
N/A
|
Wildland Fires |
|
N/A
|
Solid Waste Landfills |
|
N/A
|
USGS Geology |
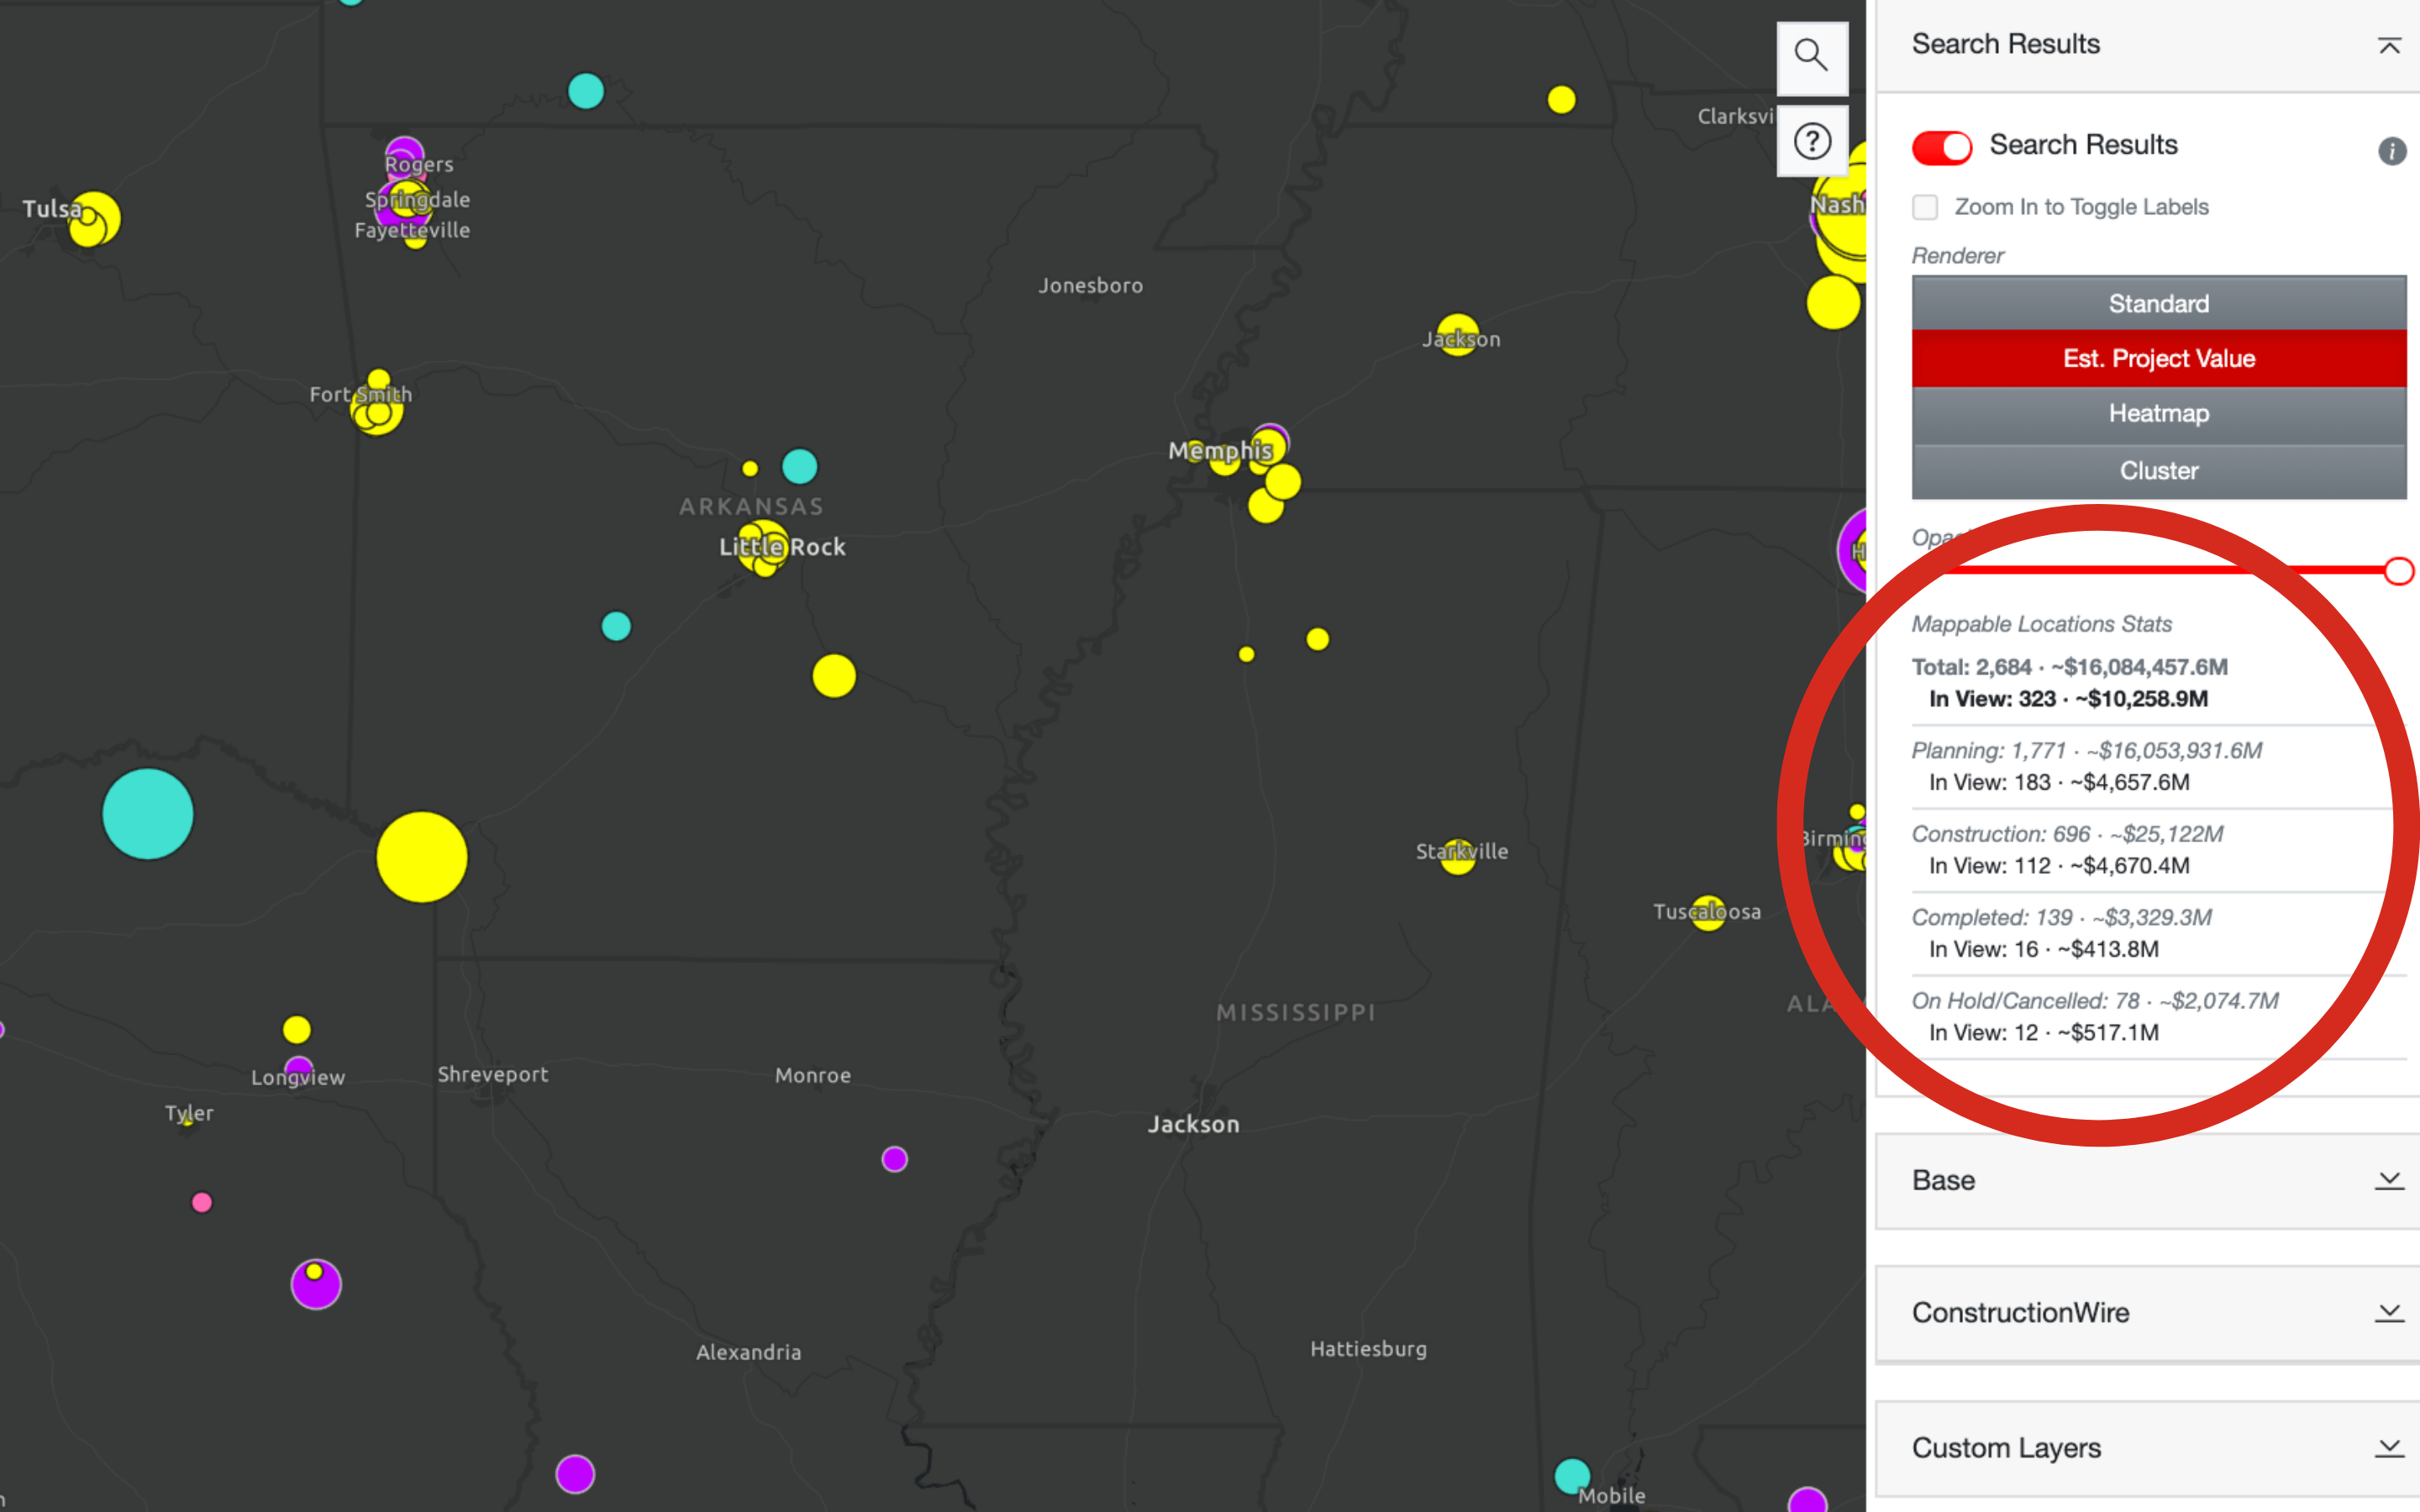
Cumulative Project Value Estimates
See the project value estimates for all projects within your map view.
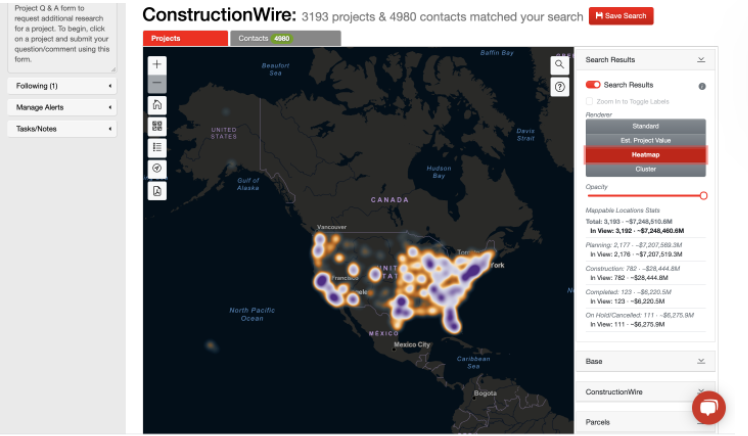
Heatmap
View projects in a heatmap to identify activity hotspots.
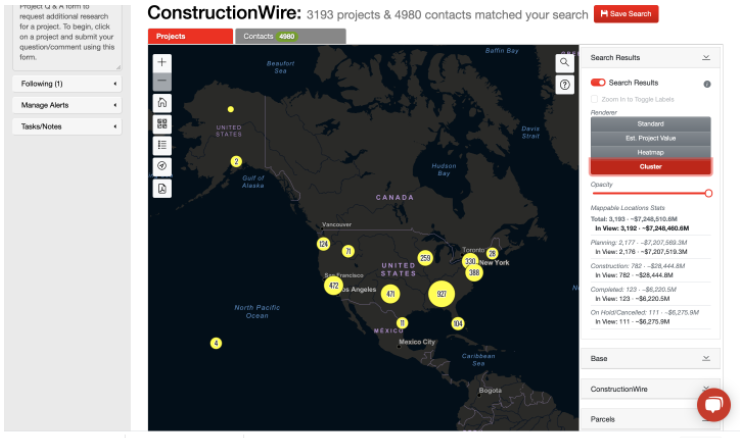
Cluster Map
Group projects in clusters for quick regional analysis.
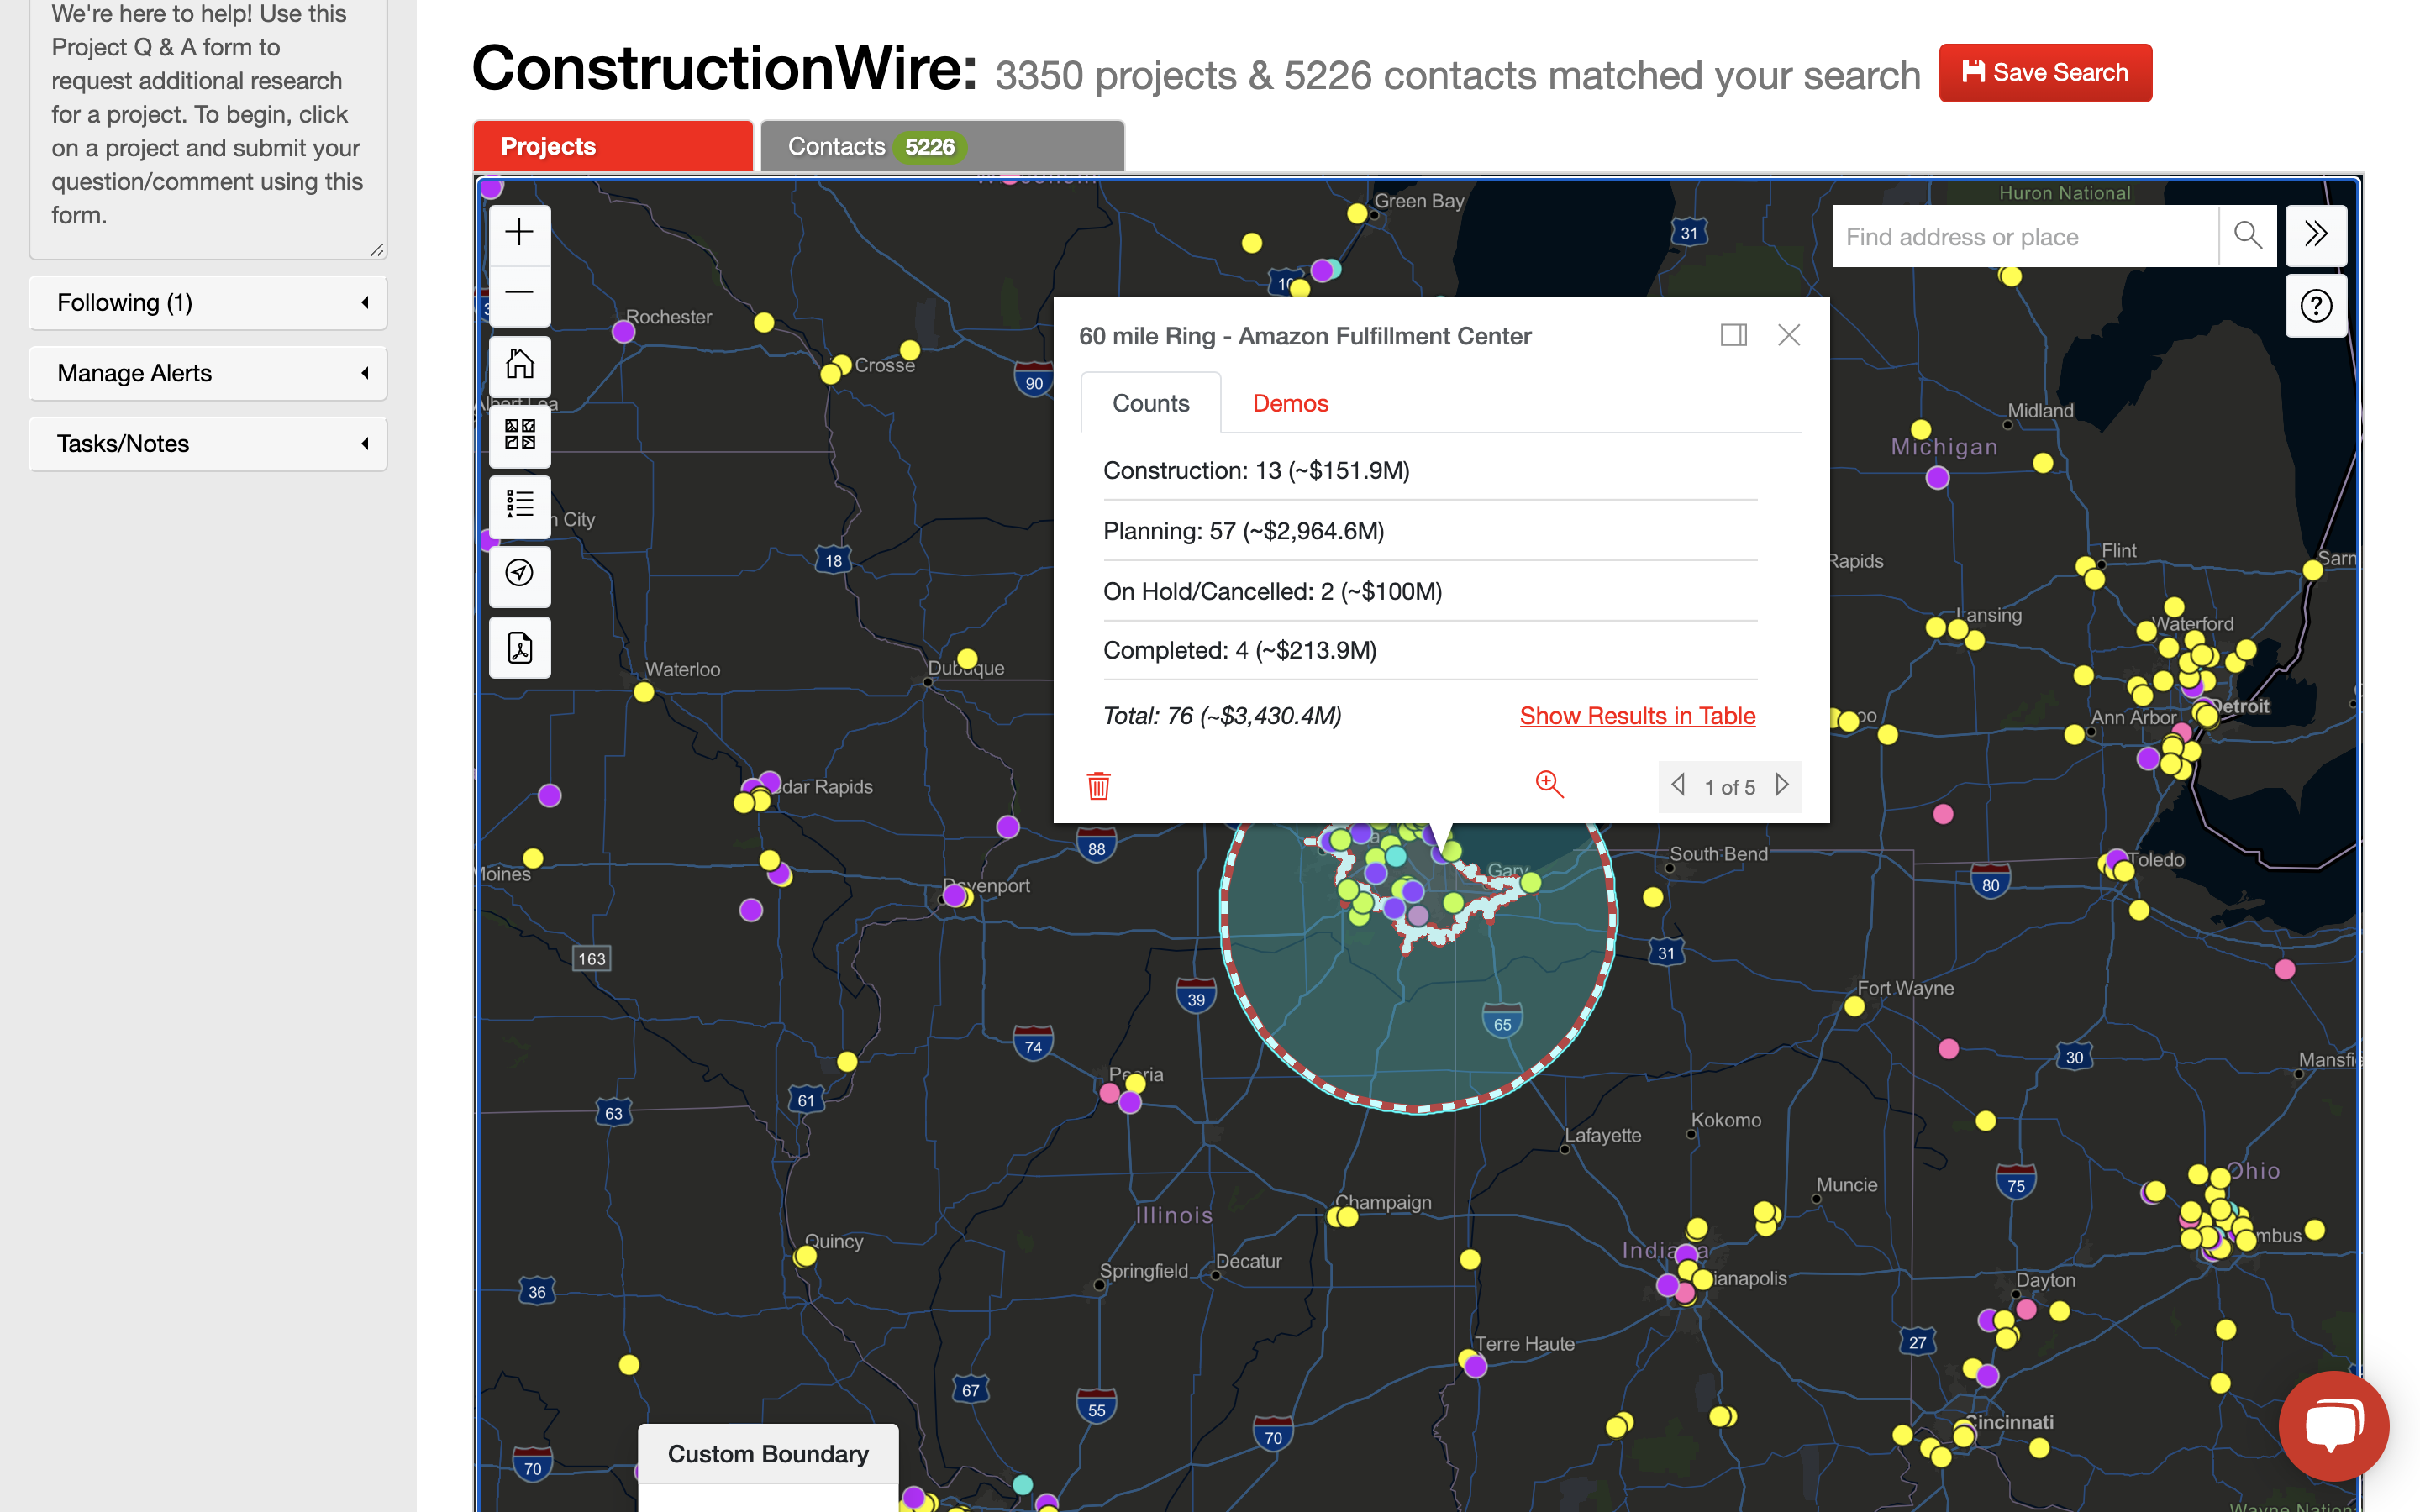
Drawing Layers
Draw a buffer (ring) at any point for drive time insights, project values, and demographics.
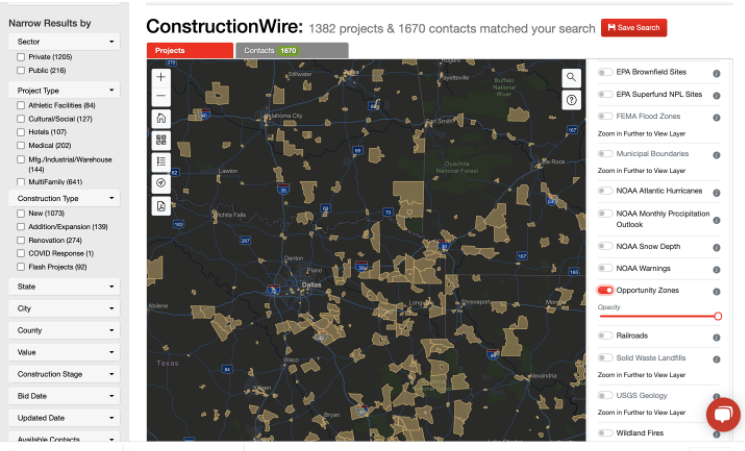
Opportunity Zones
See opportunity zones adjacent to nearby residential and commercial construction.
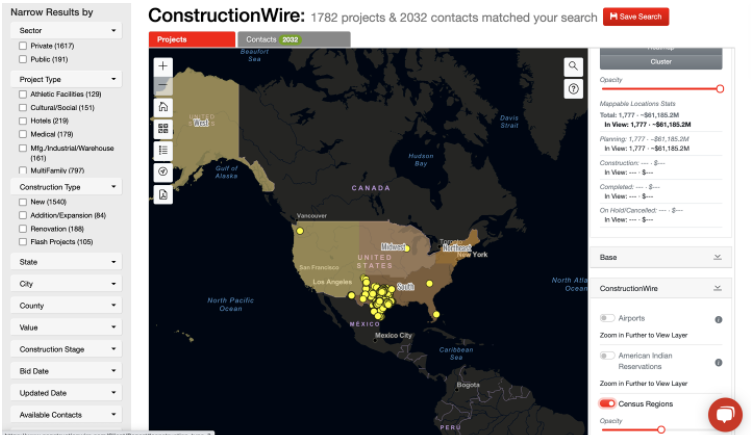
Census Regions
Drill in and see where projects exist by Census Region.
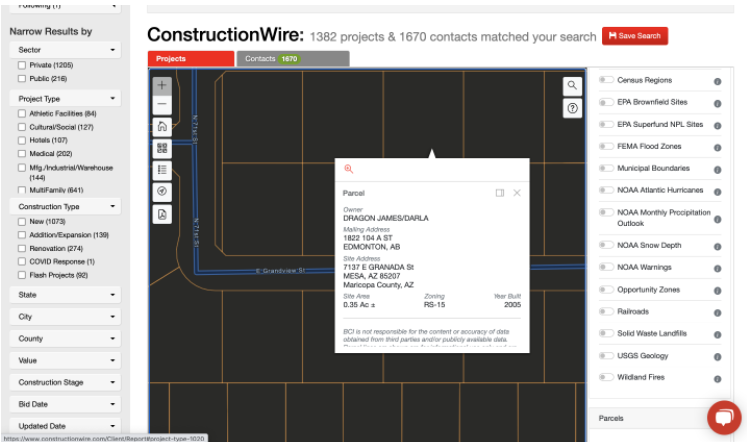
Parcel Data
See who owns properties adjacent to locations of interest.
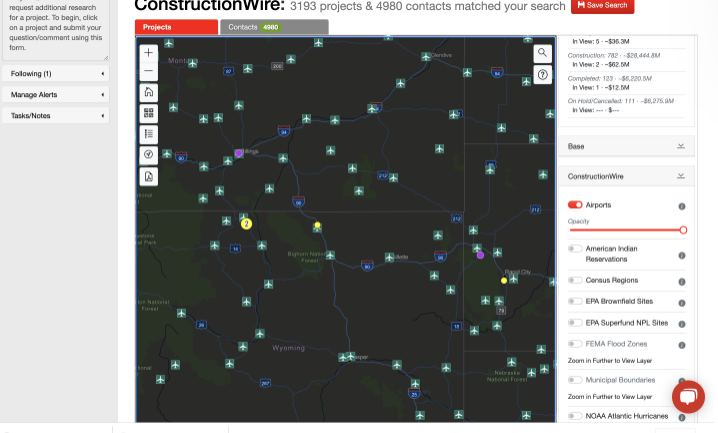
Airports Layer
See where all airports exist in proximity to projects of interest.
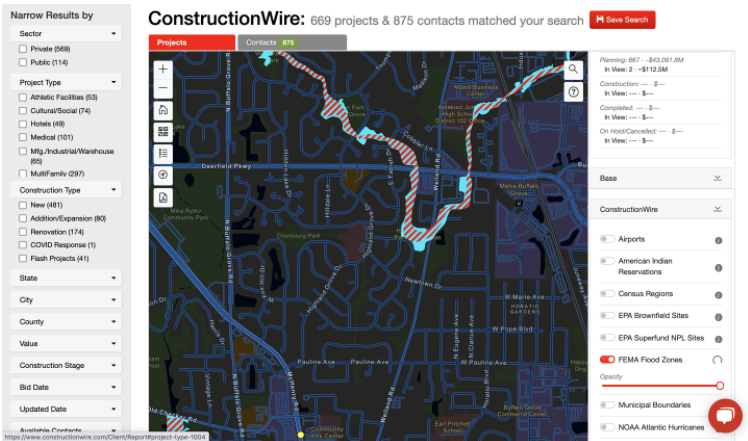
FEMA Flood Zones
Identify FEMA flood zones nearby projects or communities of interest.
EPA Superfund NPL Sites
See nearby Superfund sites nearby projects of interest.
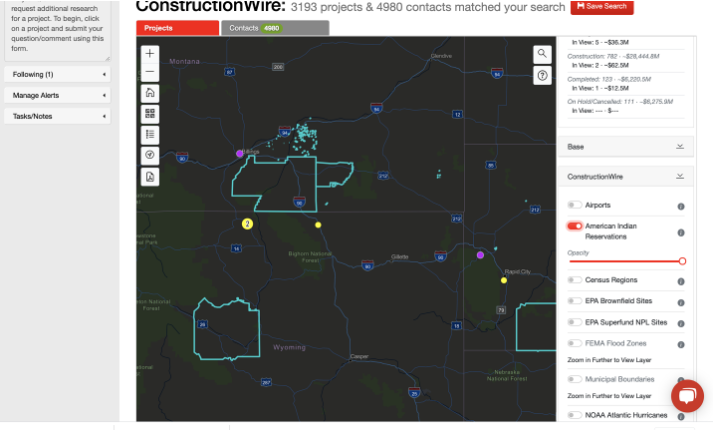
American Indian Reservations
Look at where AIR exist in proximity to projects of interest.
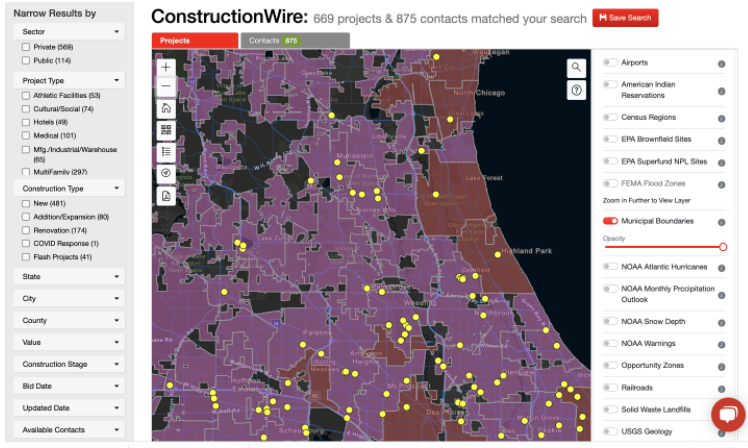
Municipal Boundaries
See the borders of municipalities. Useful for assigning sales territories.
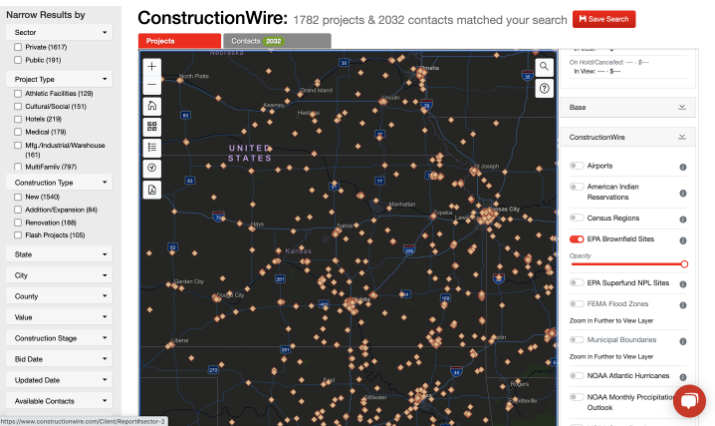
EPA Brownfield Sites
Identify nearby brownfield sites to mitigate risk.
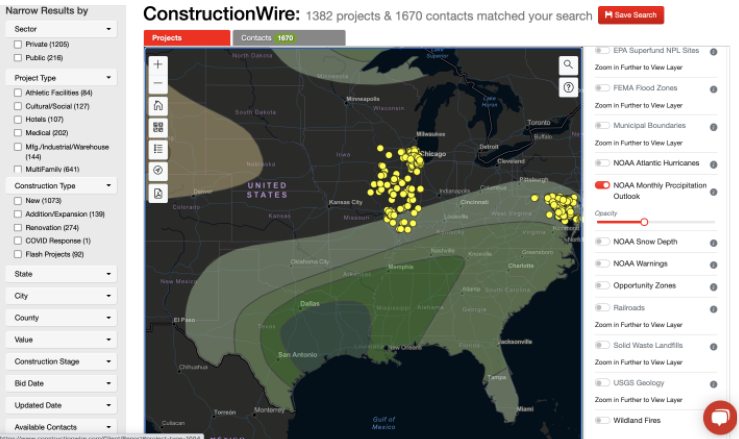
NOAA Monthly Precipitation Outlook
See where rain and snow are expected across the U.S. in relation to projects of interest.
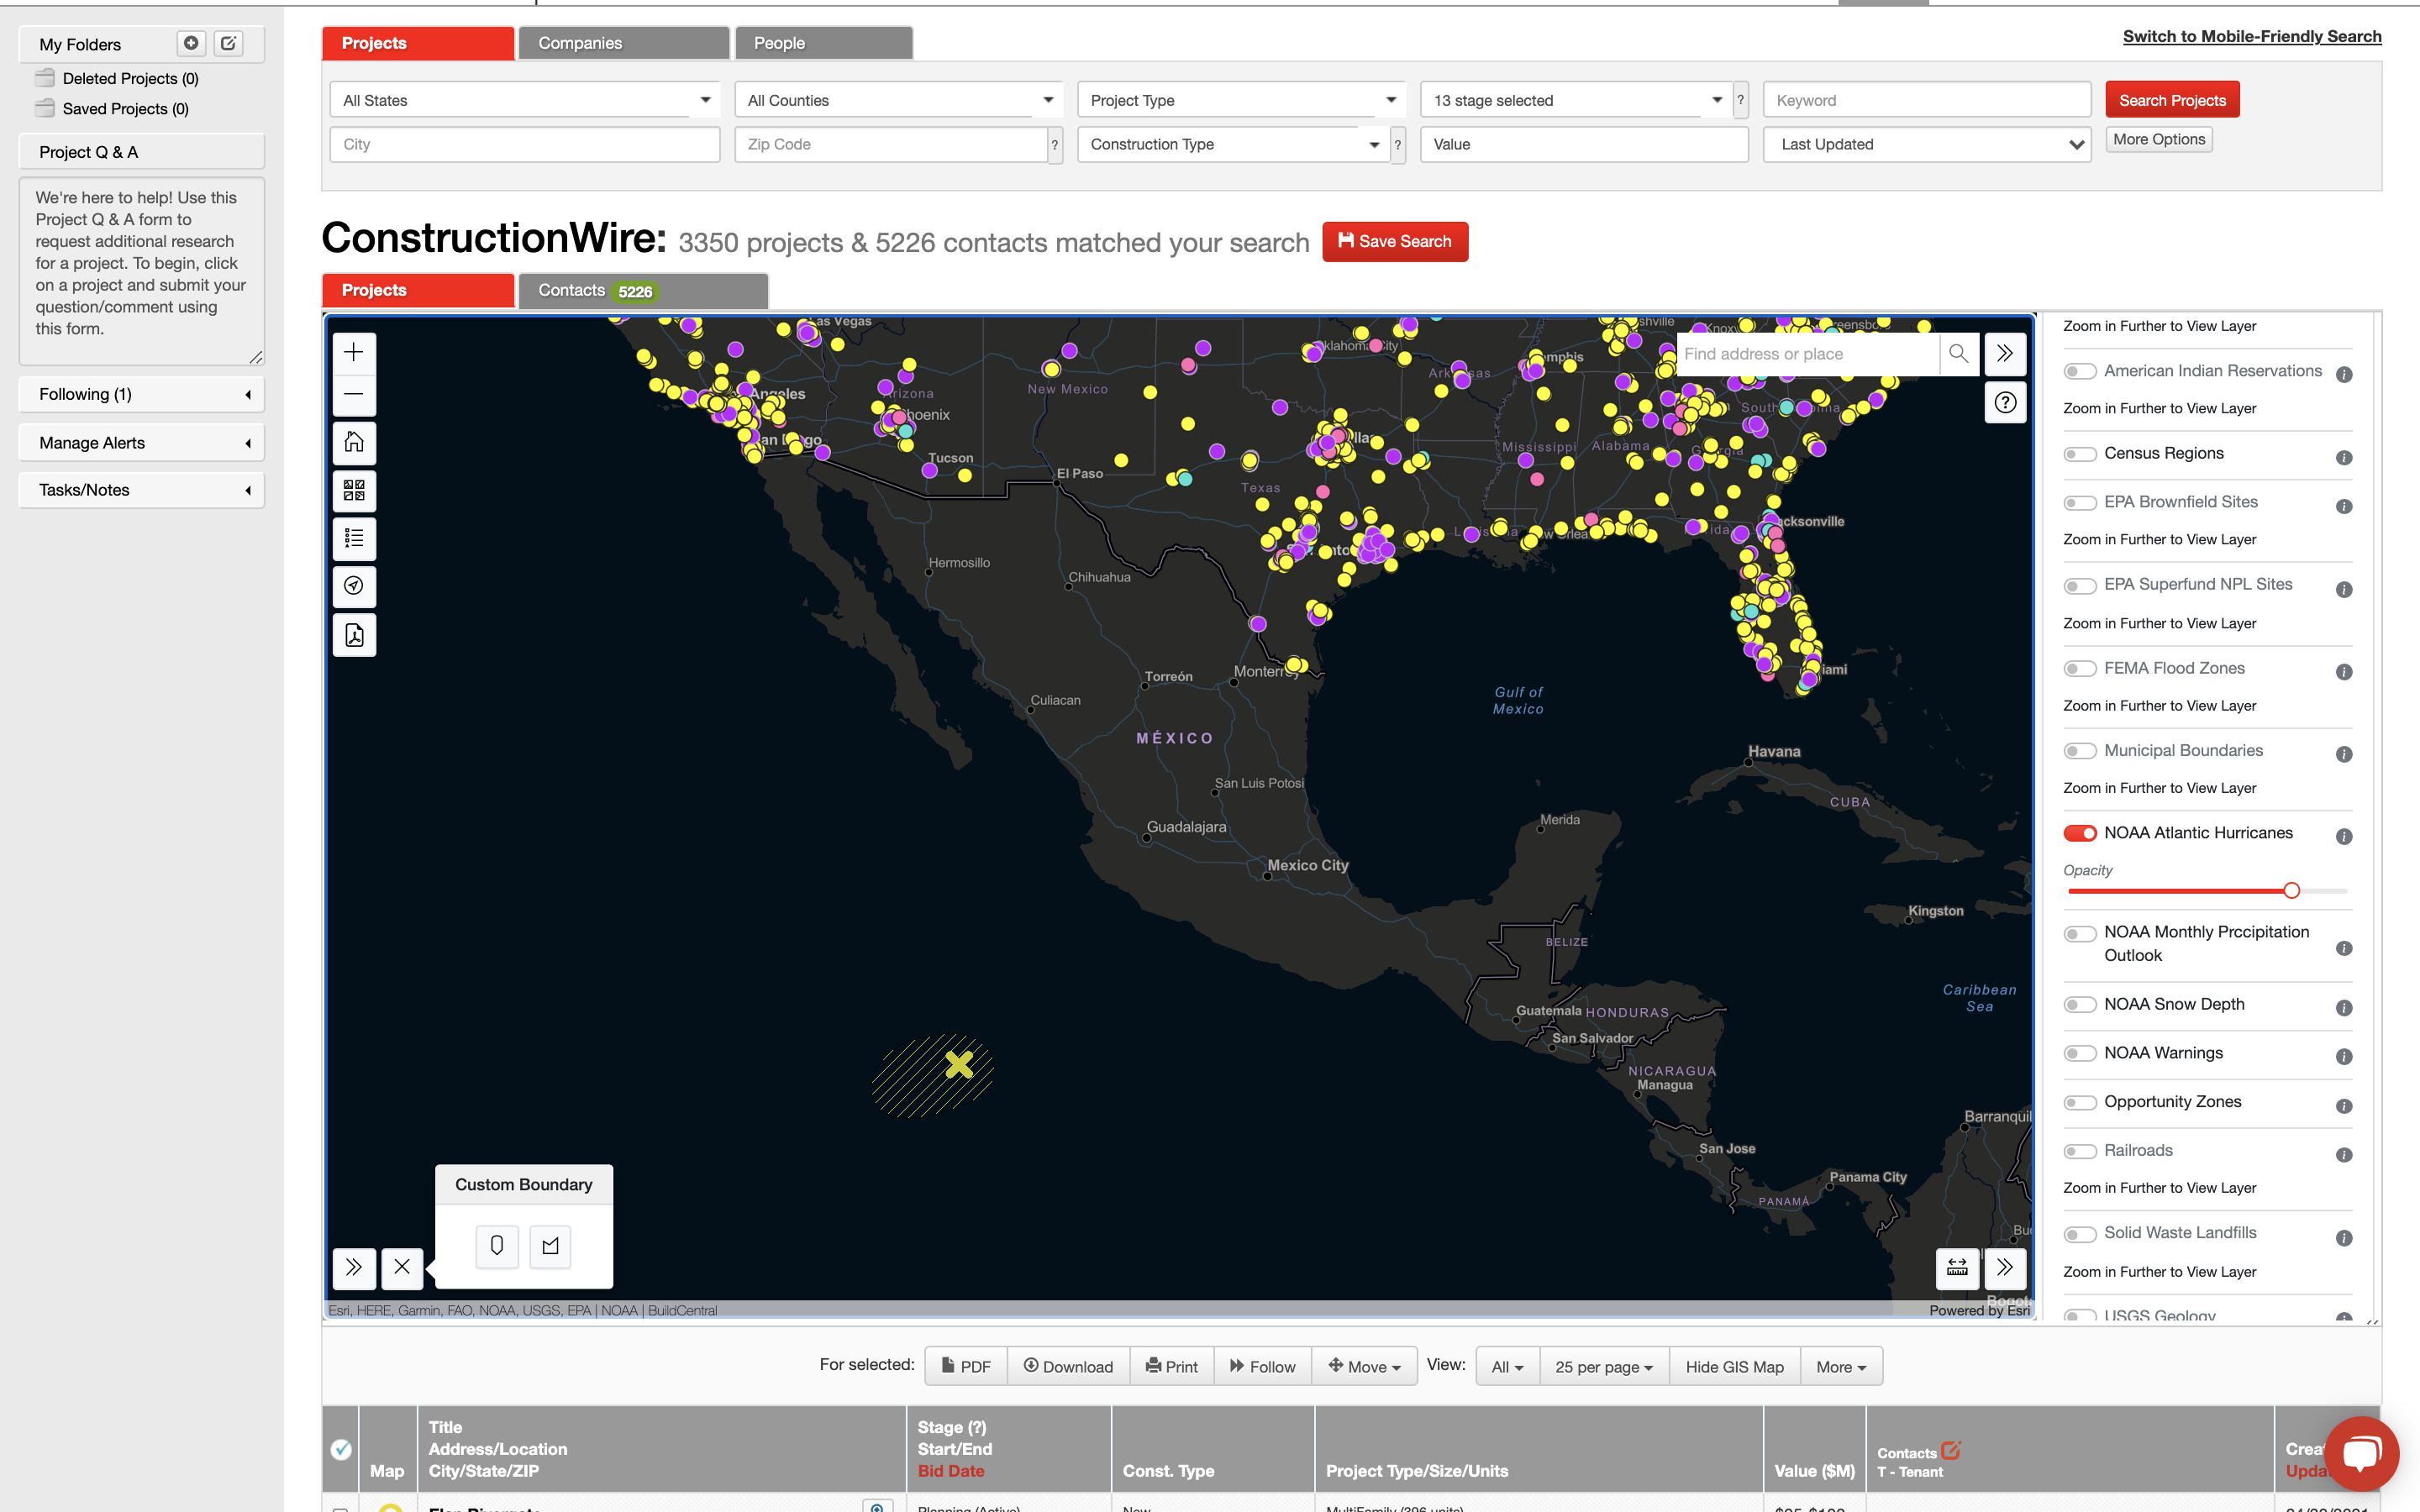
NOAA Atlantic Hurricanes
Get reports on Atlantic hurricanes in relation to key regions and projects.
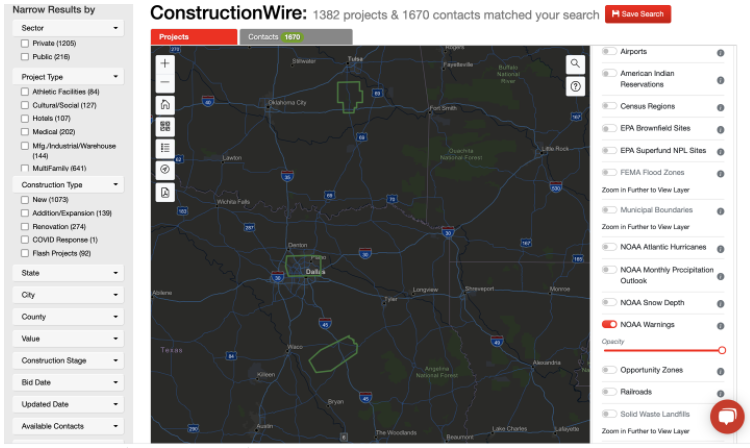
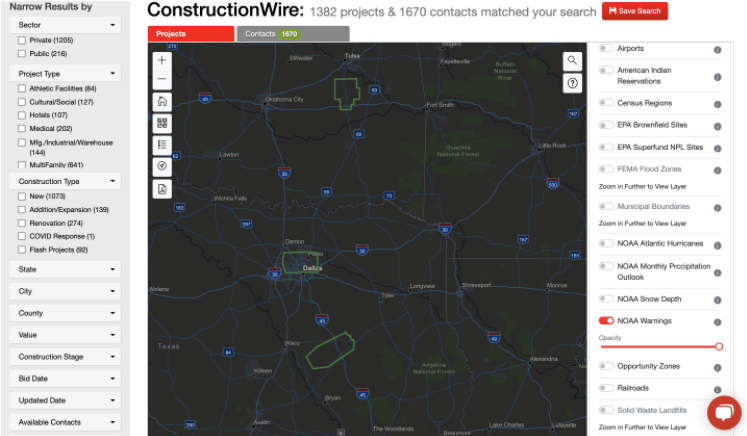
NOAA Warnings
See weather watches/warnings in near real- time.
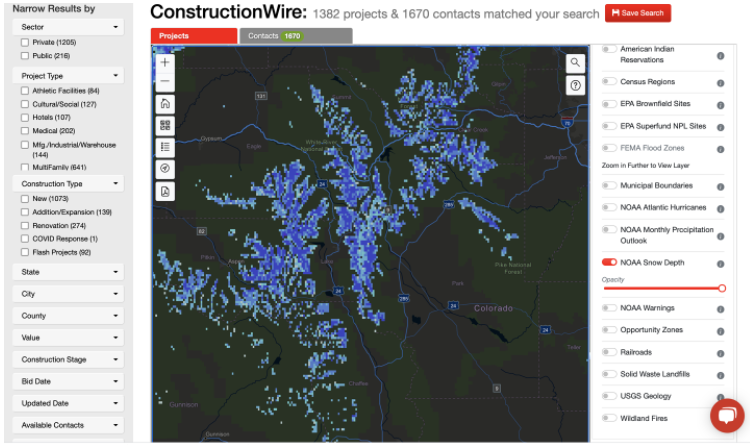
NOAA Snow Depth
See the depth of fallen snow.
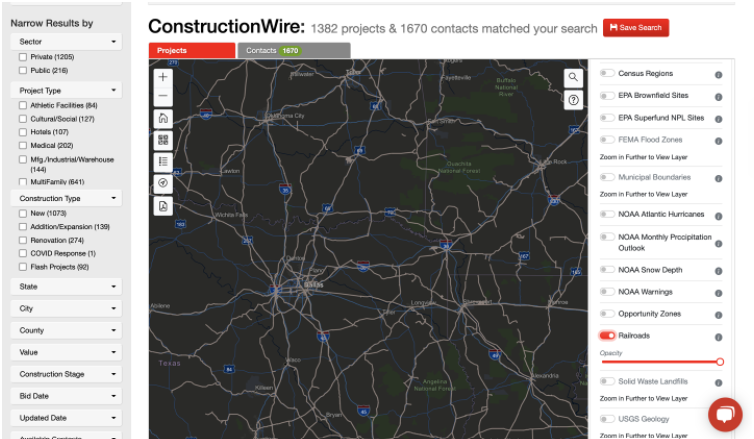
Railroads
See railroads nearby key regions, markets and projects.
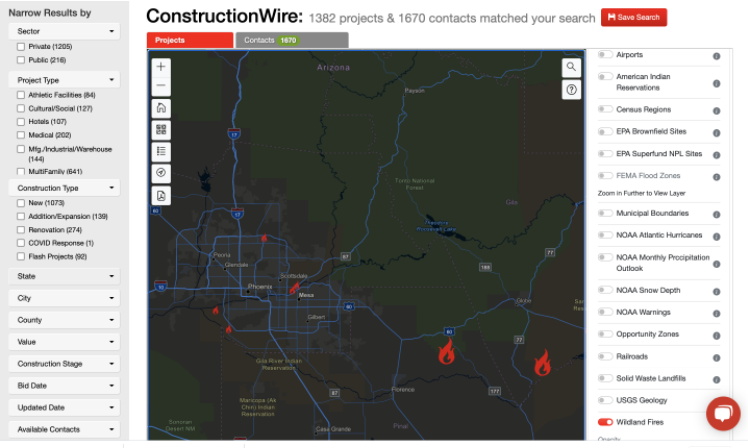
Wildland Fires
See areas prone to wildfires and the current status in near real-time.
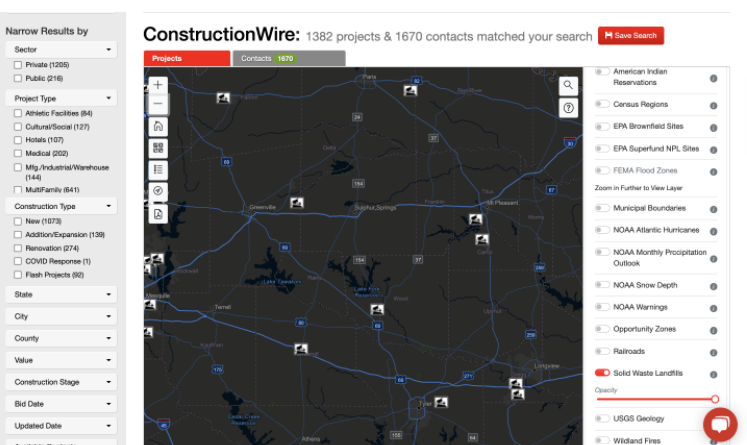
Solid Waste Landfills
See nearby landfills in relation to projects of interest.
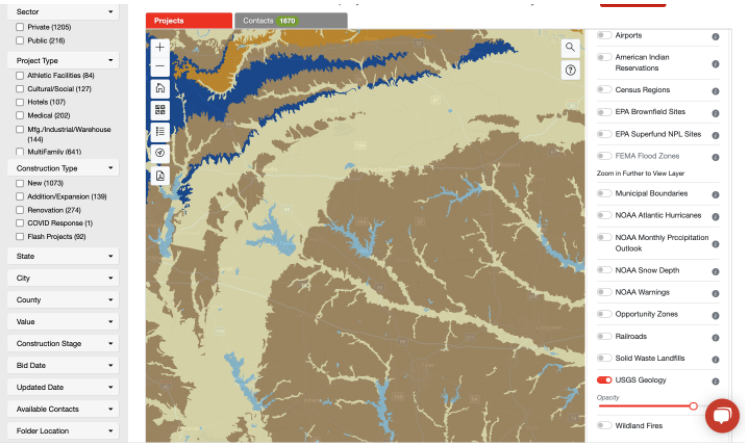
USGS Geology
See the latest geological information from the USGS.
Popular Use Cases by Industry:
| Developers |
|
| Construction Companies |
|
| Hotels |
|
|
Manufacturers of Furniture, Fixtures, Consumer Electronics and Appliances |
|
| Engineers/Architects |
|
|
|
Popular Use Cases by Role:
|
Inside Sales Rep |
See all the projects in your territory with a choice of 5 views
|
|
Outside Sales Rep |
|
|
Regional Sales Manager |
|
|
National/Vertical Sales Manager |
|
|
Marketing |
|
|
Lead Generation |
|
|
Estimators |
|
|
Project Managers |
|
| Executive or Strategic Planners |
|
|
Site Selection Specialists |
|
FAQs
- Why should I be using Geospex?
Get important insights faster. Visualization of relevant projects in context with additional data points helps you get a deeper understanding of key markets in less time. - Is there a cost for Geospex?
Yes. To upgrade please contact your account manager for pricing, or call 866-316-5300. - How do I zoom in on a specific area?
Hold shift and draw a box around the desired area for a closer view. - Can I put in an address?
Yes! Enter an address to see nearby projects of interest. - Can I go back to the old map?
No, we are retiring the old map in favor of better functionality. - Can you help train my team on this new tool?
Yes, after you upgrade please book a time with Kevin Drake in Client Services to review PREMIUM mapping functionality with your team.

