Finding projects and people within a given distance or drive-time speeds up site-selection, and it could even save you gas money by finding efficient routes between project locations.
Geospex from BuildCentral is a planned construction visualization tool. With Geospex's Heatmaps, Clusters, and a variety of interactive map overlays for geographic, demographic, and market insights, planned construction insights and analytics have never been more accessible and actionable. That isn't all, however, that Geospex can do: Geospex's drive-time and radius buffers allow users to map distance and drive-time boundaries from a given location or project site.

See the GEOSPEX video walkthrough
If it's not already clear, we'll go ahead and call out the people Geospex can help in this way: like, everyone! Are you a service provider? Supplier? Investor, manufacturer, builder, or otherwise? Buffers are a tool worth familiarizing yourself with, particularly if you're managing fleets and are looking to optimize time- and fuel-efficiency between locations.
Skip to:
- Step 1: Search for the projects you want
- Step 2: Pick a locale and a desired drive-time or distance radius
Step 1: Search for the projects you want
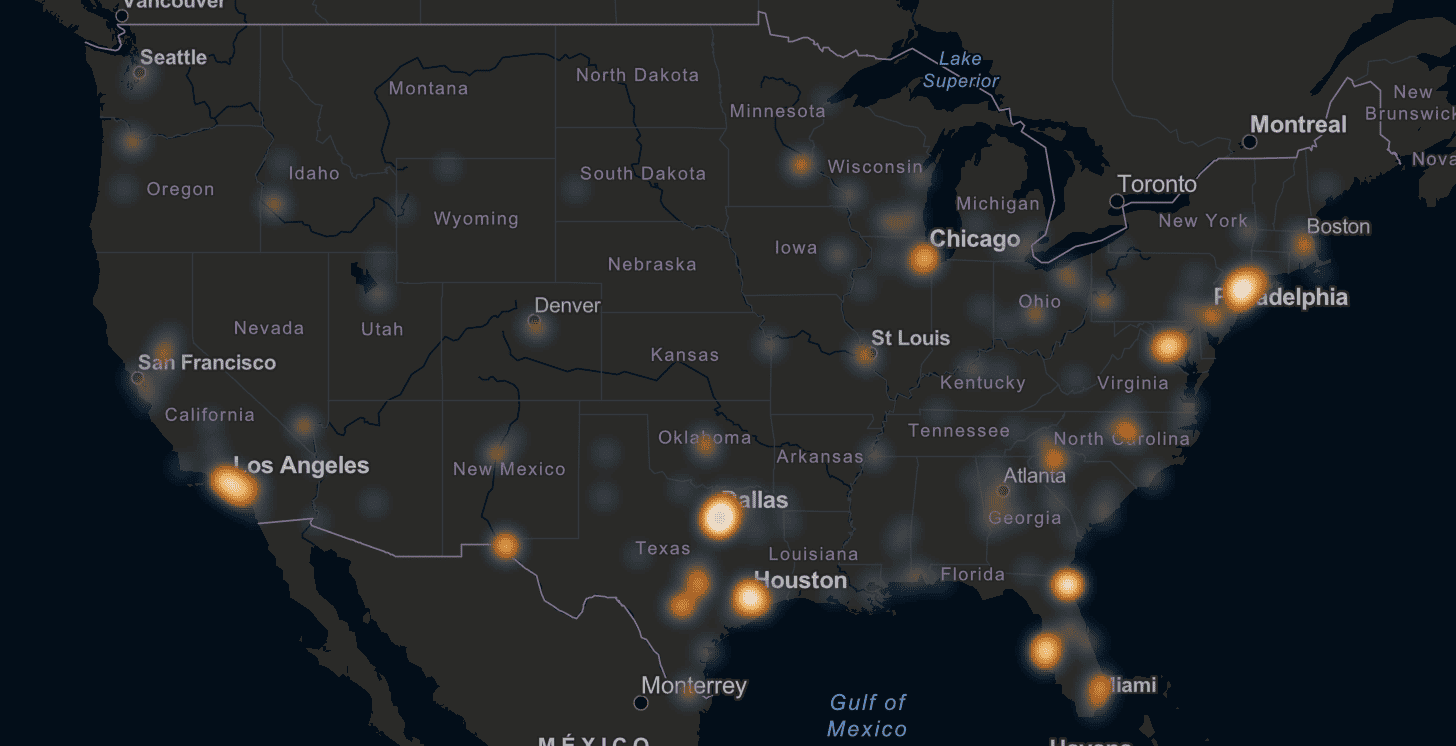
For the purposes of our example, we'll use our Planned Retail product. Say you're interested in planned and ongoing renovation or expansion projects by grocery stores. We'll start with a search using those parameters. With Geospex's Heatmap layer, we can see the areas with high planned grocery construction activity, as shown below:
Here, we see over 14 million square feet in proposed, planned, and ongoing grocery renovation or addition/expansion projects across the United States. As you can see, Los Angeles, Dallas, Houston, Chicago, and Philadelphia have particularly bright hotspots. Because we haven't yet written about it anyway, and because this article's author went to college there, let's go with Philadelphia!

Step 2: Pick a locale and a desired drive-time or distance radius
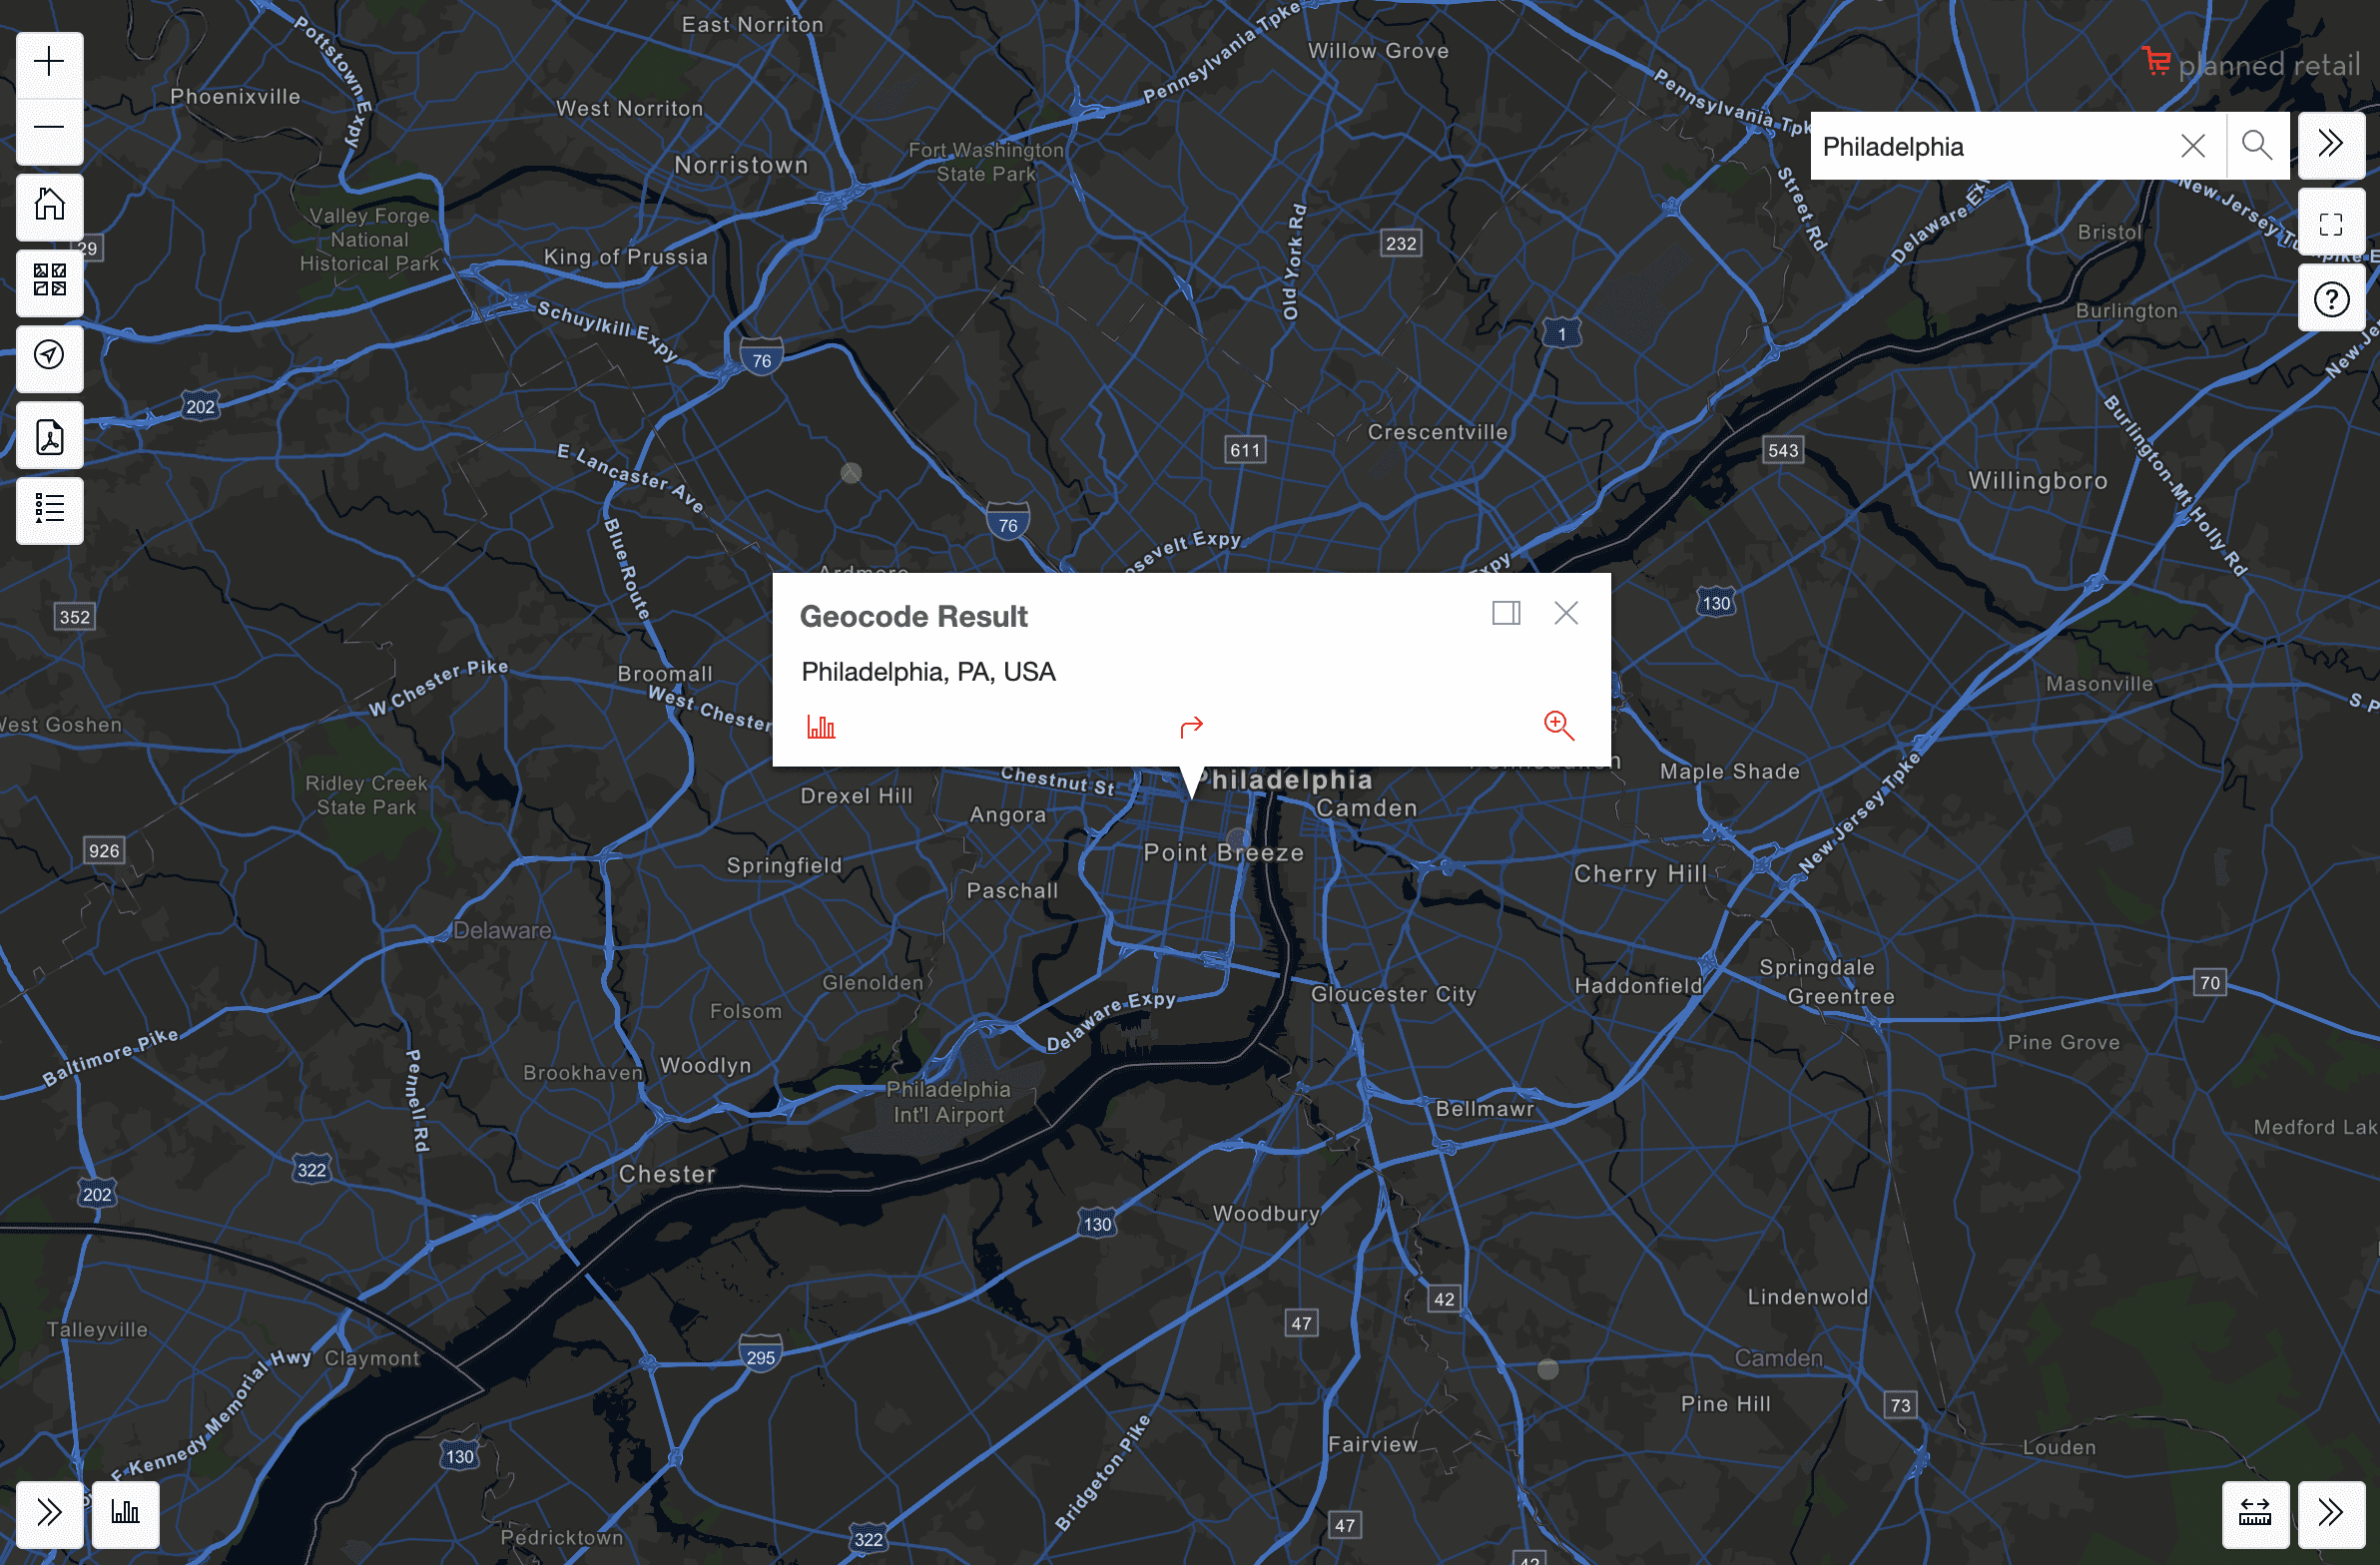
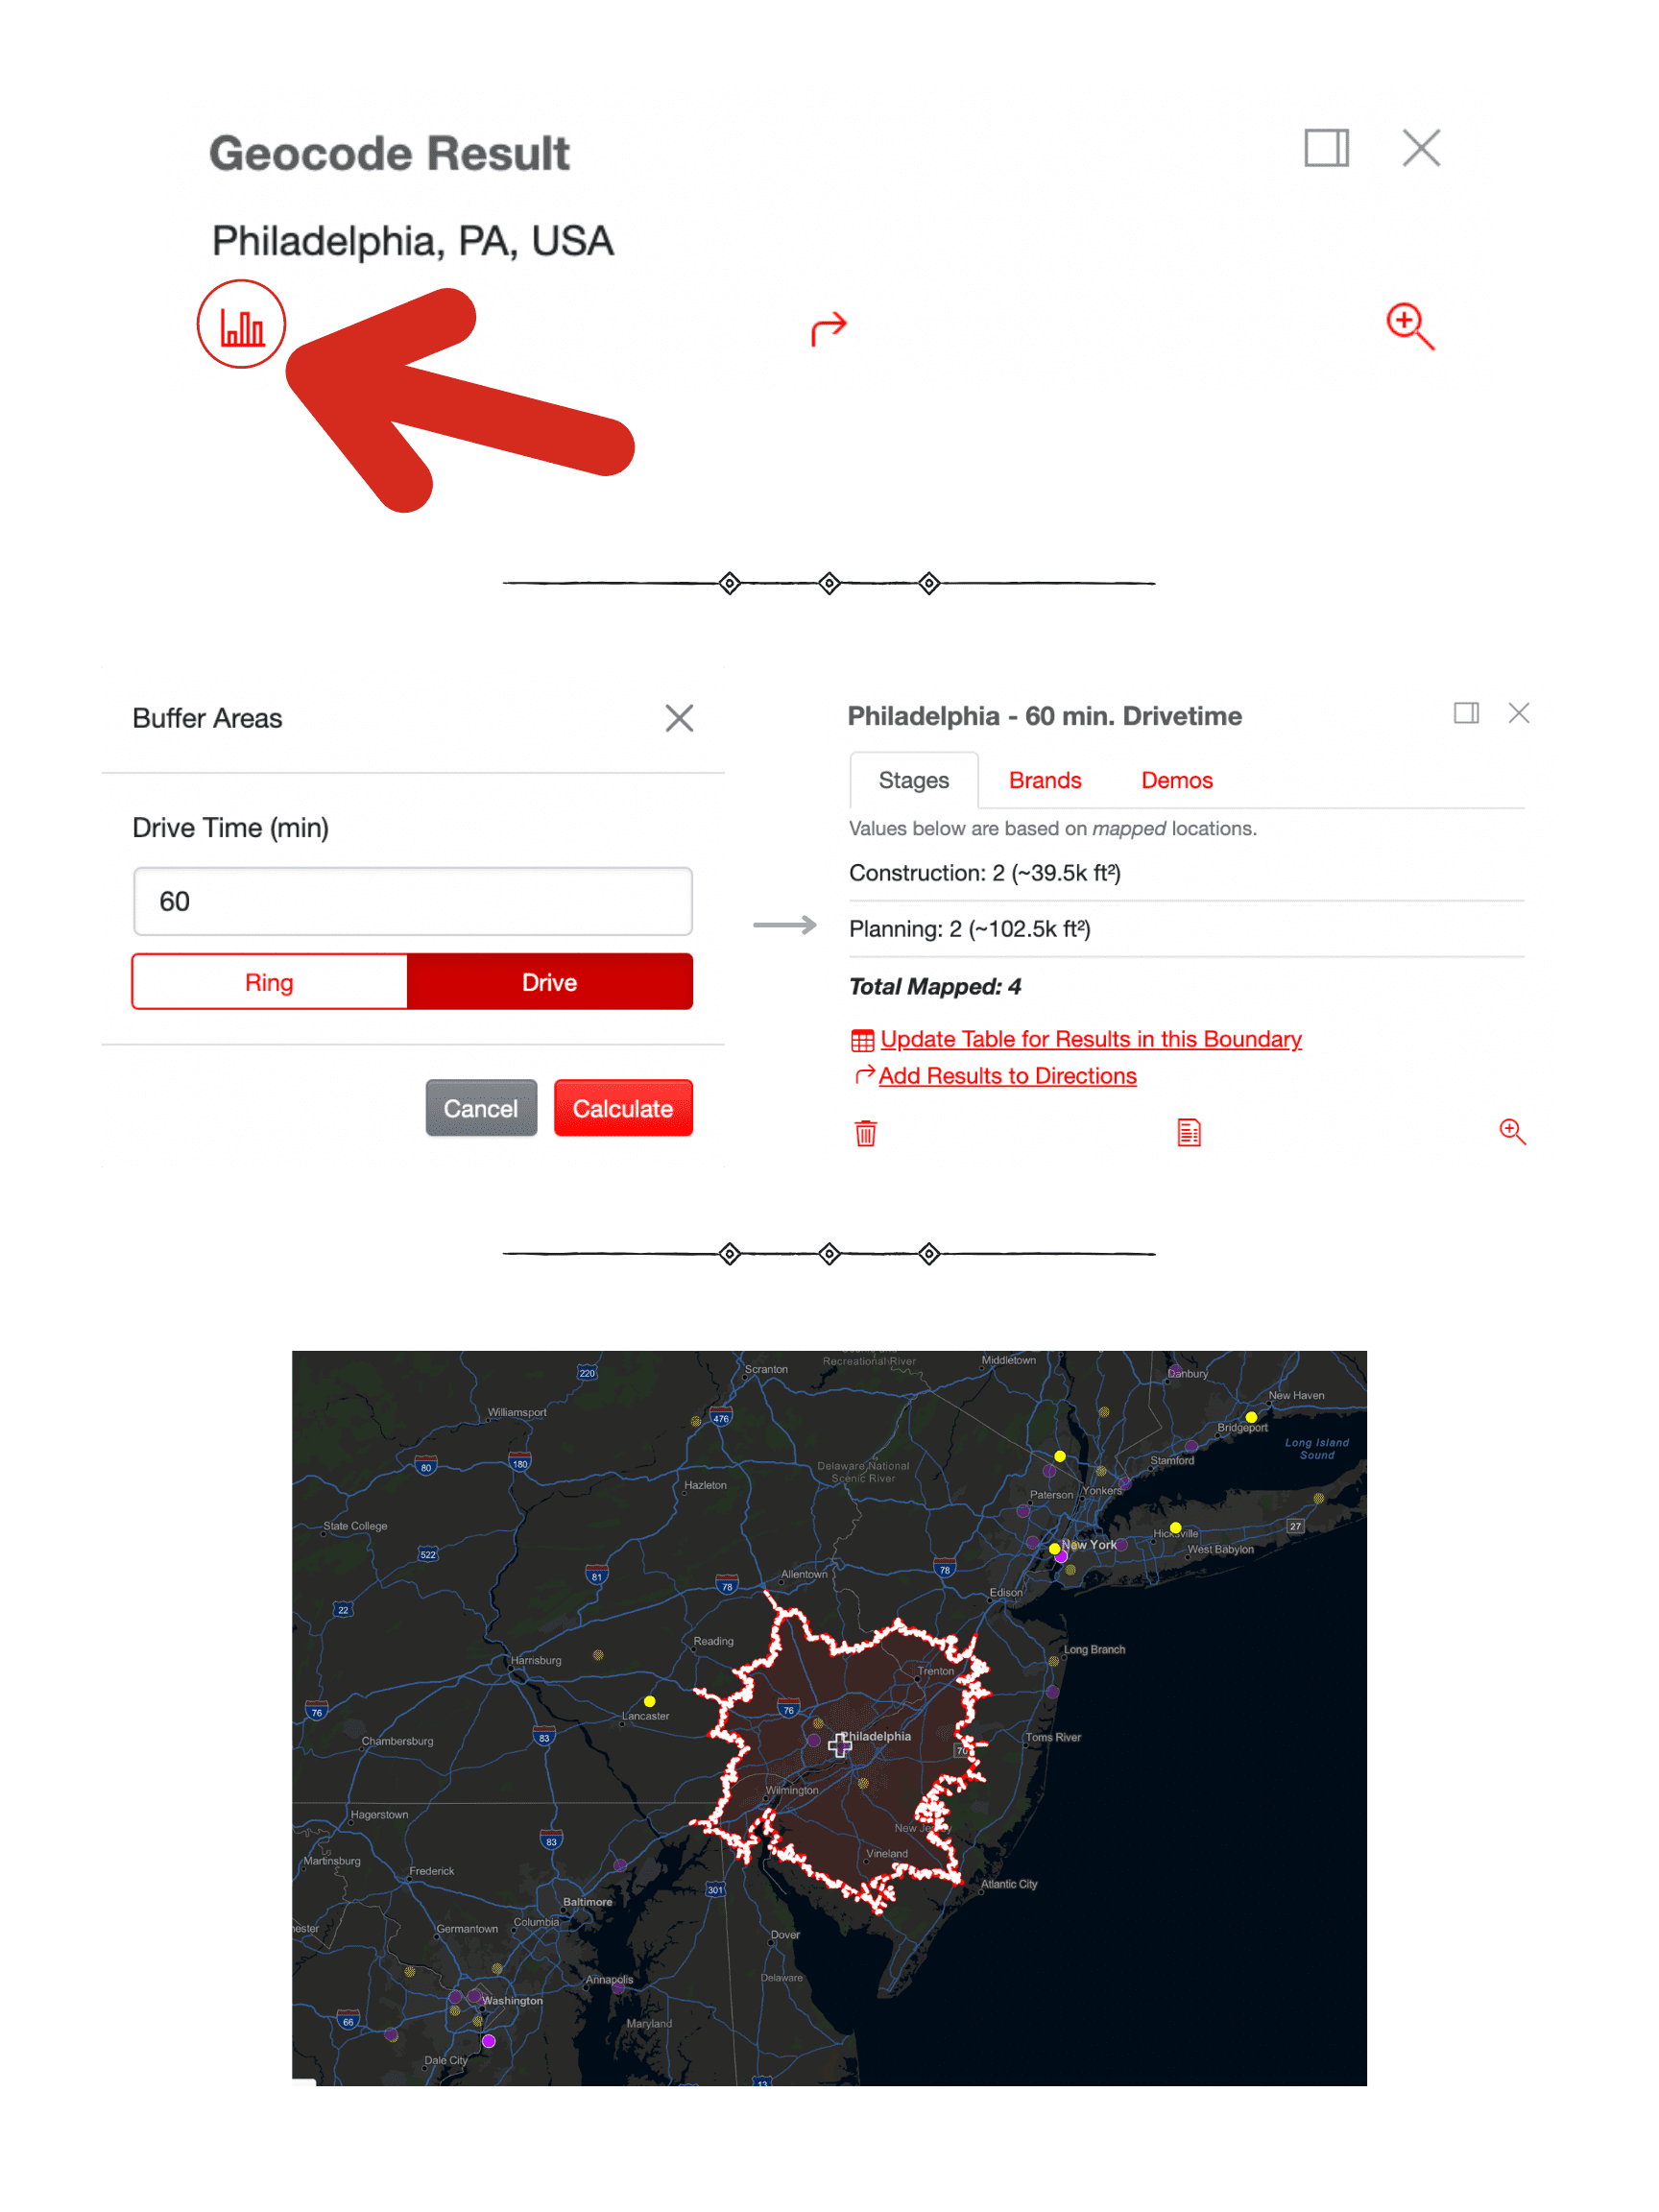
So, we searched for Philadelphia using the search bar in the top right of the Geospex map. In the bottom left of the Geocode Result pop-up for Philadelphia, you should see a bar graph icon. Click on it and proceed by entering the custom mile or drive-time boundary you want to create, as shown below. We went with projects within an hour's drive of Philly.

As you can see in the graphic above, the Geospex drive-time and radius buffer tool highlights and gives you information on the projects located within the custom boundary, the brands associated with those construction projects, and the demographic data for people in the bounded area. Evidently, the nearby New York and Washington, D.C. metropolitan areas appear to be real hubs for grocery renovation and addition/expansion projects.
This example is of course quite rudimentary and straightforward, but it should also give you a sense not only for the kind of granular data points that BuildCentral collects and presents, but also for the myriad ways in which BuildCentral's visualization and data analysis tools can serve your company's needs while optimizing its daily operations.

